It is natural to guess that conception would be promoted by a healthy amount of cervical fluid lining the way from where sperm are deposited to the location of the egg. In particular as we age less cervical fluid is produced so the two solutions to give the sperm the red carpet treatment are 1) find a way to produce more cervical fluid naturally (this may or may not be possible, but there are plenty of suggestions as to how it can be done), or 2) use a "sperm friendly" lubricant. One such lubricant is called preseed. We have been using it minimally so far, just when we need it and just enough for comfort. We have not yet used it according to the instructions, which suggest to insert a certain amount directly at the entrance of the cervix.
One question we have is whether or not the preseed is harming the sperm, or hindering their movement. So we decided to do an experiment. DH was kind enough to provide a sample of his semen. We placed a drop of it on a slide along with a drop of preseed next to it and placed a slide cover over it. We then took a video of it under a microscope. At the border region where the semen meets the preseed the sperm flow over into it. This is what we saw.
At the beginning of the video the camera focuses on sperm moving in semen alone which has been out of the body for about 30 minutes. From 1:07 the image begins to shift from the region of semen alone, through the region of mixed semen and preseed, towards the region of preseed alone. From 2:30 the camera shows the region deep on the side of the preseed. A similar experiment was performed in [1].
What we have learned from this experiment is that preseed alone is a less healthy medium than semen. As sperm move over into the region with the preseed they slow down. They become slower and slower as they move deeper into the preseed. If they remain in the region of the preseed almost all of them will stop moving within about a half hour whereas within the semen there are still a large number of healthy very mobile sperm after an hour.
While the video clearly shows that preseed alone is an unhealthy environment for sperm what is unclear is how it compares with cervical mucous. This is a future experiment. The amount of preseed used could also be an important factor. A study in [2] suggests that sperm motility is only marginally affected when the amount of preseed added to the semen is 10%. Our video also indicates that sperm still appear relatively OK in the border region where they move in lower concentrations of preseed.
What is clear is that preseed provides a healthier environment for sperm than any dry environment, where sperm would die almost instantaneously. One might guess that preseed could work well in cases where the entrance to the cervix is dry, if the sperm do not need to survive for very long, that is, when the egg is already waiting or is about to be released. So, it could be that the following analogy applies: When the cervical environment is dry, the path of the sperm to the egg is essentially blocked by a wall of fire, but when the passage is filled with preseed, then it is as if the wall has been removed and replaced by a treacherous path over hot coals.
Overall I am not convinced one way or the other. I will wait to make a judgement until after we have performed a few more experiments.
[1] https://www.youtube.com/watch?v=SI7MJXkEMns
[2] Ashok Agarwal, Fnu Deepinder, Marcello Cocuzza, Robert A Short, and Donald P Evenson, Effect of vaginal lubricants on sperm motility and chromatin integrity: a prospective comparative study, Fertility and sterility 89 (2008), no. 2, 375–379.
http://www.fertstert.org/article/S0015-0282(07)00518-3/abstract
Saturday 13 June 2015
Wednesday 10 June 2015
Fern test + BBT charting, cont. [Cycle 7]
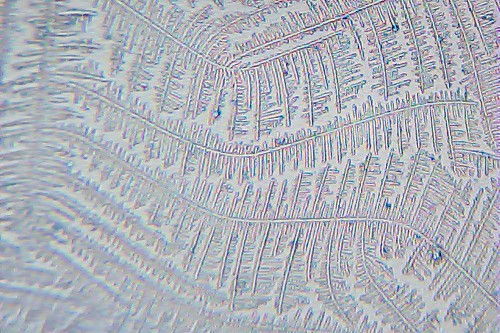
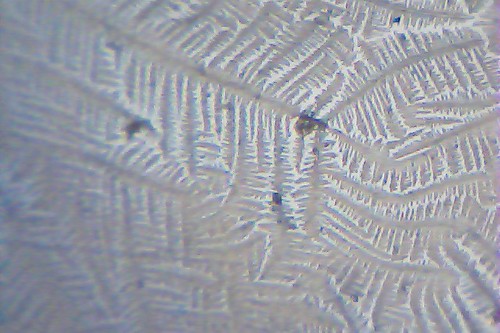
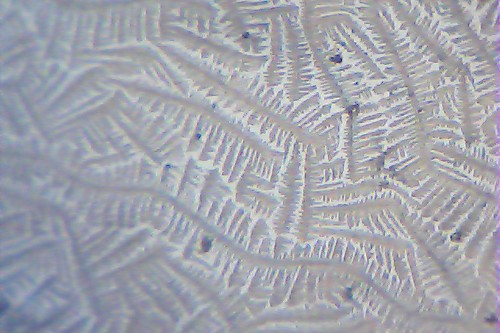
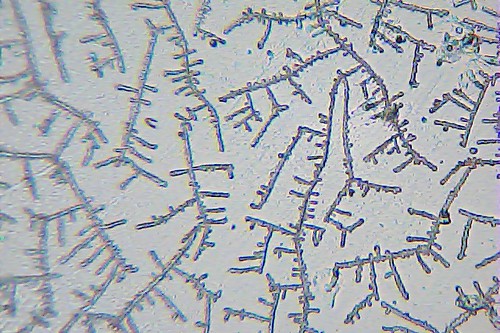
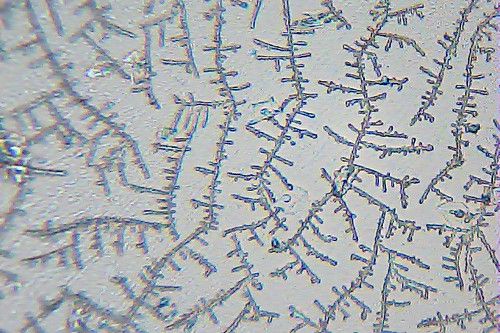
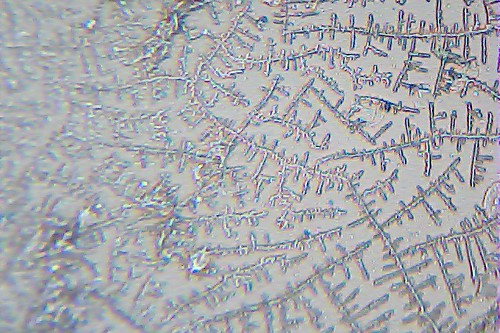
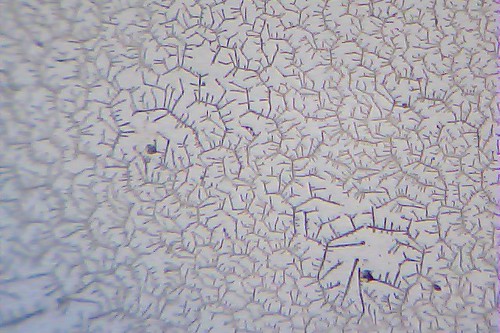
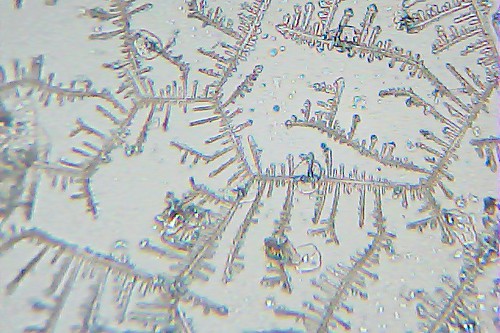
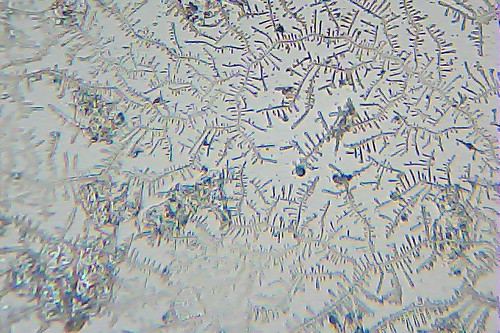
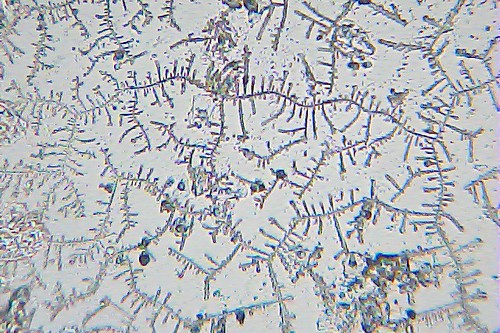
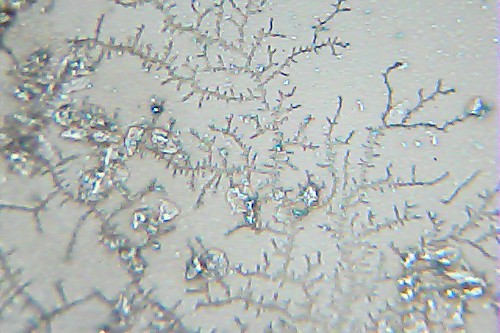
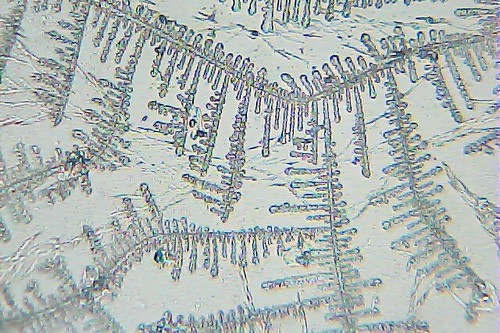
We are officially past 6 cycles ttc, so we are planning to make our first trip to the doctor to find out if there is anything preventing us from conceiving. At the moment it is difficult to hazard a guess other than our ages, in particular mine. I am 36. DH is 33. This cycle we will try focusing our intercourse on the night before and the day of ovulation, skipping the 2 days before these, rather than doing the recommended every day / every other day in the fertile window. The idea is that in this way the egg can only be fertilised by fresh sperm, and not older sperm. We are again using the fern test to track estrogen levels, and bbt charting to track progesterone. Here are the first saliva samples. Bbt chart to appear.
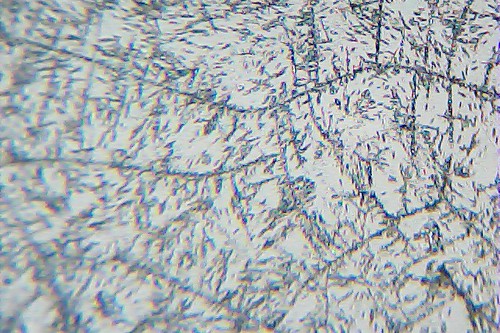
cd 1:
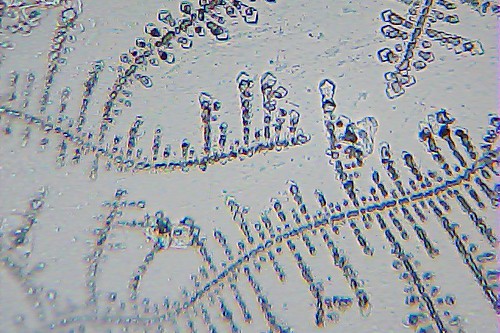
cd 2:
cd 3:
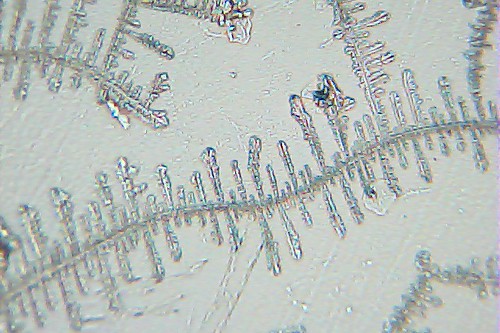
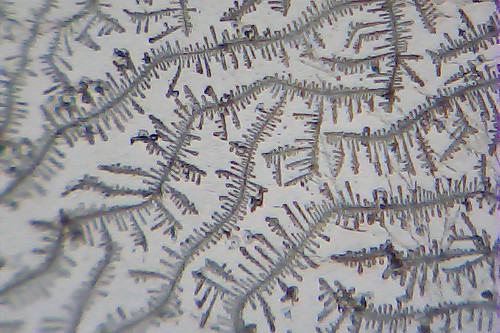
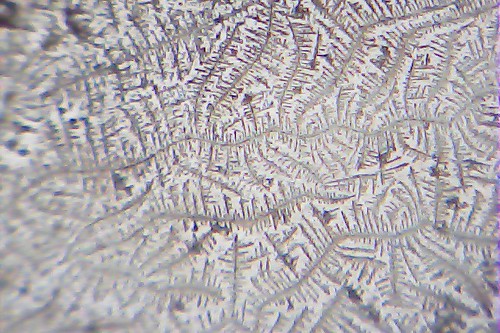
4x power:
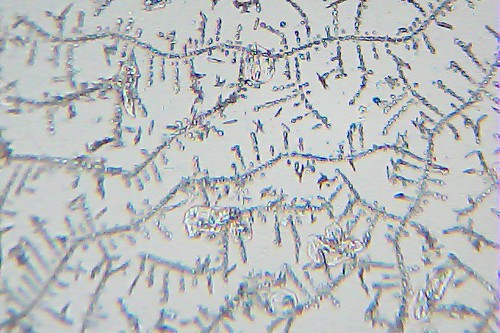
cd 4:
cd 5:
cd 6:
4x power:
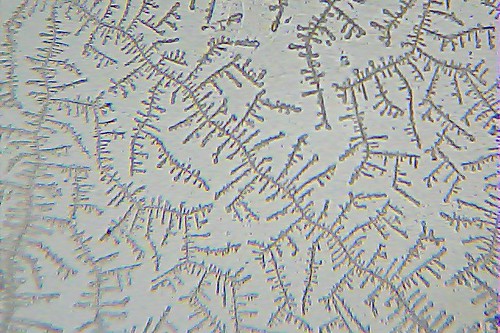
cd 7:
cd 8:
cd 1:
cd 2:
cd 3:
4x power:
cd 4:
cd 5:
cd 6:
4x power:
cd 7:
cd 8:
Sunday 17 May 2015
hormones
I have been thinking a lot about hormones since we began TTC. Estrogen and Progesterone play important roles in preparing the uterus for implantation and fetal development. We have begun using the fern test to track estrogen in my cycles, and using bbt charting to track progesterone. A little digging produces the following
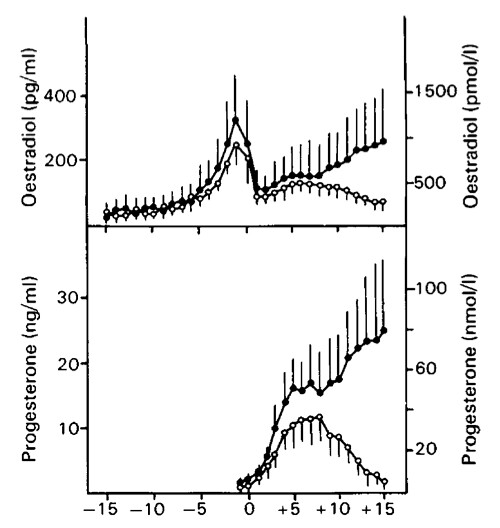 The figure on the left is from the study in [1]. It shows estrogen and progesterone concentrations as a function of the number of days from LH peak for women who conceive and for those who do not. The filled circles are averages for 26 conception cycles, and the open circles are averages from 27 non-conception cycles. Since the LH peak occurs 24-36 hours before the egg is released, day 1 is O-day, not day 0. From this data one can see that both estrogen and progesterone start to fall, on average, after about 7 dpo, unless conception takes place.
What is also interesting about the figure from [1] is that the difference in progesterone levels between conception and non-conception cycles is noticeable from 2-3 dpo. This may indicate that a higher concentration of progesterone helps implantation to take place, rather than that fertilisation has signalled for progesterone to be produced.
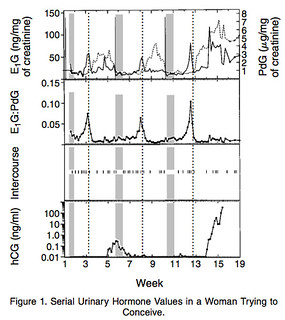 One can also consider what happens for a single individual. The figure on the right is from the study in [2]. It shows estrogen and progesterone levels for 3 cycles of one woman, who conceived in her third cycle. The thick grey bands represent days of menstruation and the dotted lines ovulation. The ticks represent days of intercourse. E1G is a metabolite of estrogen, and PdG is a metabolite of progesterone. What we can learn from this is that both estrogen and progesterone concentrations show significant fluctuations day by day, but in the conception cycle they both show a marked increase after about 1 week past ovulation compared to the non-conception cycles.
In the first cycle of the figure from [2] it appears that a chemical pregnancy has taken place, given the low concentration of hCG in weeks 5-6. It may be that estrogen and/or progesterone concentrations were not high enough to produce an endometrium lining which can sustain the fetus, or that the fertilised egg in this cycle was simply not viable at the time of implantation. In either case, the authors speak of "cycle viability", referring to the ability for a given ovulatory cycle to result in pregnancy. They find the proportion of viable cycles to be on average around 0.37.
What I have gathered from this information is that, with regard to the fern test, my estrogen will peak 1-2 days before O-day. In addition, both estrogen and progesterone should on average keep rising after around 7 dpo in the case of successful conception, and fall in the case of non-conception.
[1] Elizabeth A Lenton, Rafida Sulaiman, O Sobowale, and ID Cooke, The human menstrual cycle: plasma concentrations of prolactin, lh, fsh, oestradiol and progesterone in conceiving and non-conceiving women, Journal of reproduction and fertility 65 (1982), no. 1, 131–139.
www.ncbi.nlm.nih.gov/pubmed/6804627
[2] Allen J Wilcox, Clarice R Weinberg, and Donna D Baird, Timing of sexual intercourse in relation to ovulationeffects on the probability of conception, survival of the pregnancy, and sex of the baby, New England Journal of Medicine 333 (1995), no. 23, 1517–1521.
www.nejm.org/doi/full/10.1056/nejm199512073332301
The figure on the left is from the study in [1]. It shows estrogen and progesterone concentrations as a function of the number of days from LH peak for women who conceive and for those who do not. The filled circles are averages for 26 conception cycles, and the open circles are averages from 27 non-conception cycles. Since the LH peak occurs 24-36 hours before the egg is released, day 1 is O-day, not day 0. From this data one can see that both estrogen and progesterone start to fall, on average, after about 7 dpo, unless conception takes place.What is also interesting about the figure from [1] is that the difference in progesterone levels between conception and non-conception cycles is noticeable from 2-3 dpo. This may indicate that a higher concentration of progesterone helps implantation to take place, rather than that fertilisation has signalled for progesterone to be produced.
One can also consider what happens for a single individual. The figure on the right is from the study in [2]. It shows estrogen and progesterone levels for 3 cycles of one woman, who conceived in her third cycle. The thick grey bands represent days of menstruation and the dotted lines ovulation. The ticks represent days of intercourse. E1G is a metabolite of estrogen, and PdG is a metabolite of progesterone. What we can learn from this is that both estrogen and progesterone concentrations show significant fluctuations day by day, but in the conception cycle they both show a marked increase after about 1 week past ovulation compared to the non-conception cycles.In the first cycle of the figure from [2] it appears that a chemical pregnancy has taken place, given the low concentration of hCG in weeks 5-6. It may be that estrogen and/or progesterone concentrations were not high enough to produce an endometrium lining which can sustain the fetus, or that the fertilised egg in this cycle was simply not viable at the time of implantation. In either case, the authors speak of "cycle viability", referring to the ability for a given ovulatory cycle to result in pregnancy. They find the proportion of viable cycles to be on average around 0.37.
What I have gathered from this information is that, with regard to the fern test, my estrogen will peak 1-2 days before O-day. In addition, both estrogen and progesterone should on average keep rising after around 7 dpo in the case of successful conception, and fall in the case of non-conception.
[1] Elizabeth A Lenton, Rafida Sulaiman, O Sobowale, and ID Cooke, The human menstrual cycle: plasma concentrations of prolactin, lh, fsh, oestradiol and progesterone in conceiving and non-conceiving women, Journal of reproduction and fertility 65 (1982), no. 1, 131–139.
www.ncbi.nlm.nih.gov/pubmed/6804627
[2] Allen J Wilcox, Clarice R Weinberg, and Donna D Baird, Timing of sexual intercourse in relation to ovulationeffects on the probability of conception, survival of the pregnancy, and sex of the baby, New England Journal of Medicine 333 (1995), no. 23, 1517–1521.
www.nejm.org/doi/full/10.1056/nejm199512073332301
Saturday 16 May 2015
Fern test, cont. (round 2) [Cycle 6]
Hi Everyone,
TTC cycle #6 for us. We're trying the fern test again together with bbt charting. Here are the saliva samples, followed by the bbt chart.
cd 1:
cd 2:

cd 3:
cd 4:
cd 5:
cd 6:
cd 7:
cd 8:
cd 9:
cd 10:
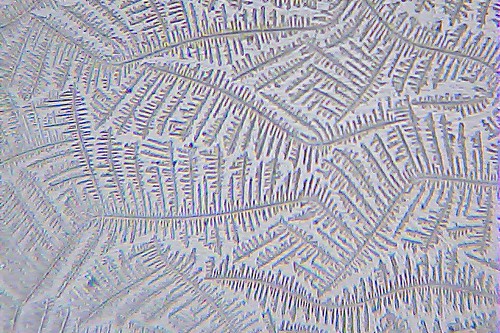
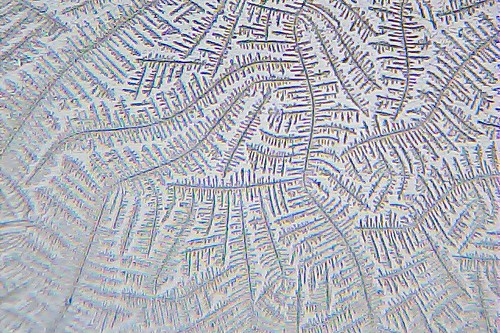
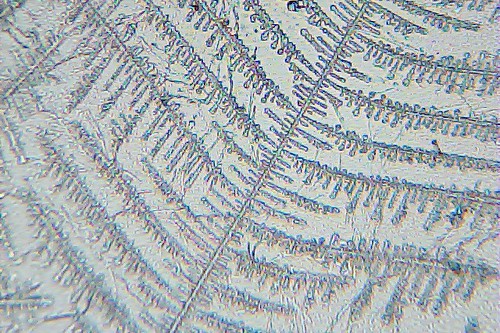
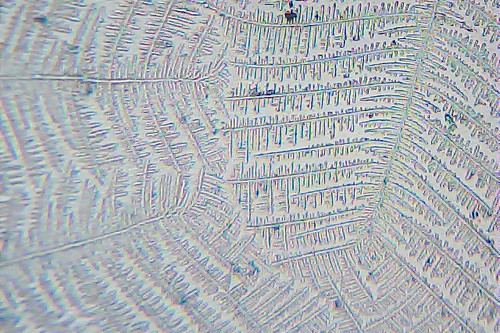
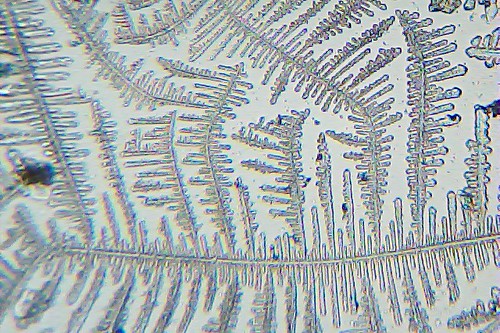
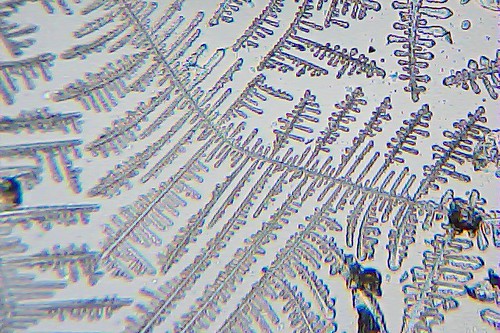
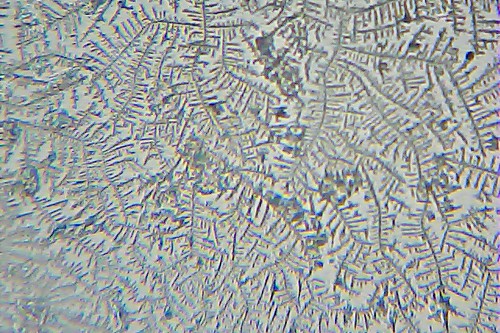
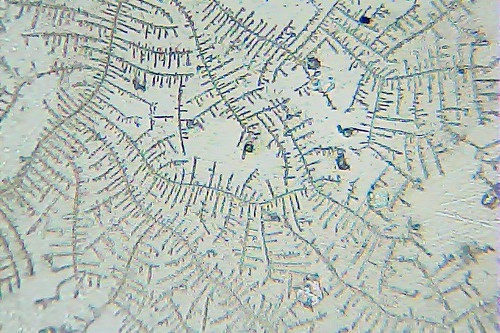
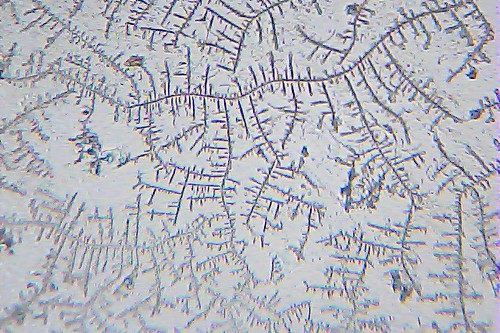
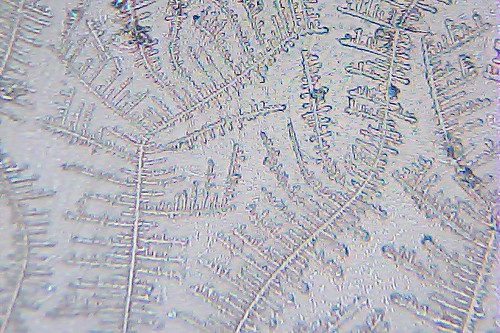
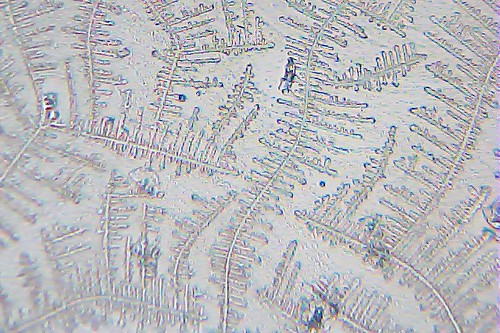
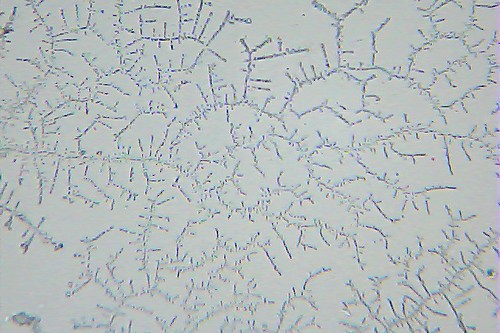
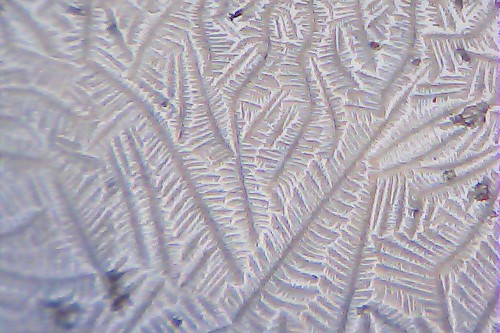
cd 11: Full ferning - indicates O in the next day or 2..
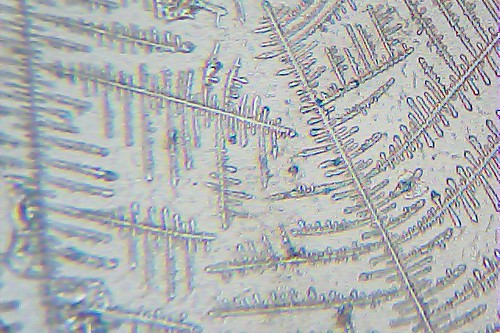
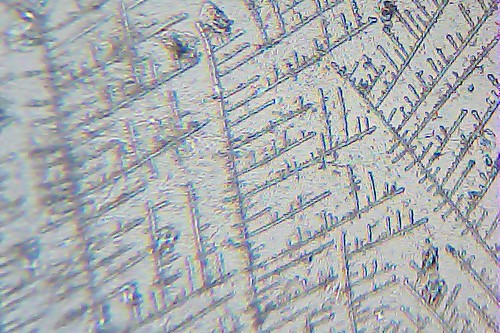
4x power:
cd 12 (O-day (confirmed by temps)):
cd 13 (1 dpo):
4x power:
cd 14 (2 dpo):
cd 15 (3 dpo):
cd 16 (4 dpo):
4x power:
cd 17 (5 dpo):
4x power:
cd 18 (6 dpo):
cd 19 (7 dpo):
4x power:
cd 20 (8 dpo):
4x power:
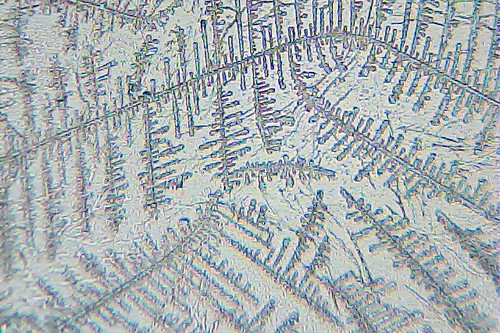
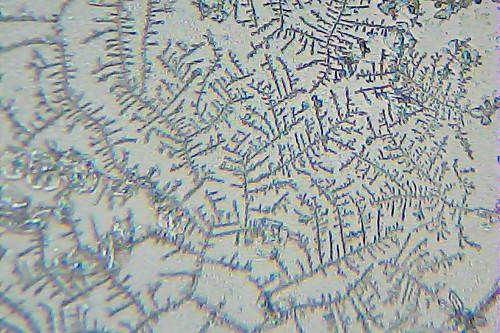
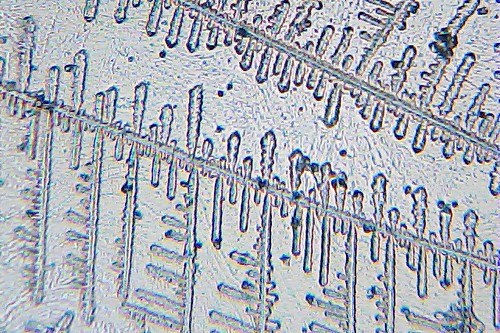
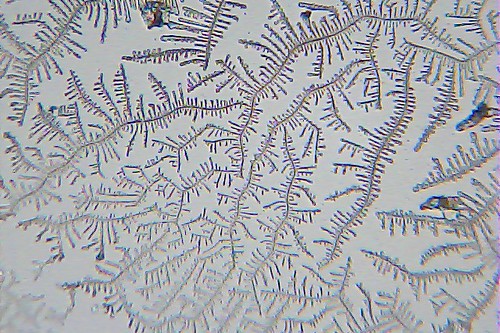
cd 21 (9 dpo): Full ferns! (random estrogen spike?)
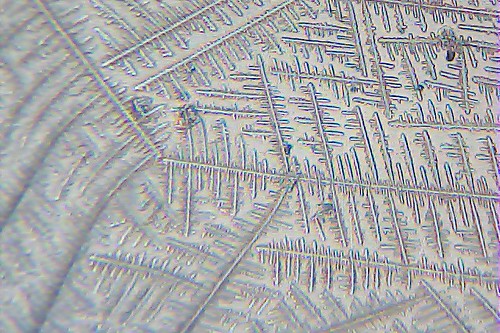
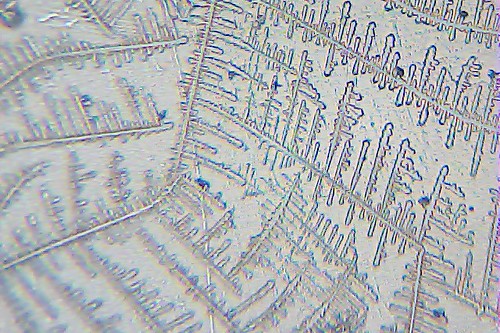
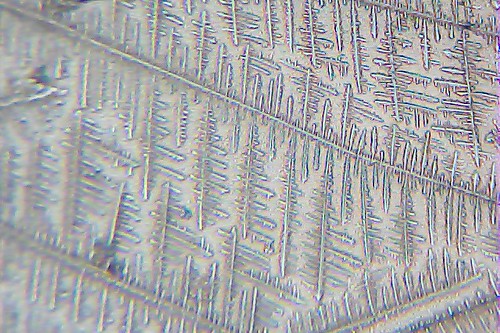
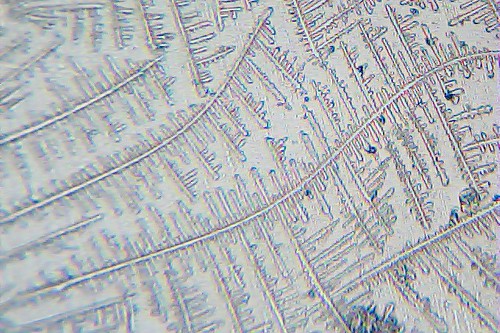
4x power:
cd 22 (10 dpo):
cd 23 (11 dpo): Very full ferns! (random estrogen spike this far past O-day seems odd...)
4x power:
cd 24 (12 dpo):
cd 25 (13 dpo) / cd 1 of next cycle: Menses start
Chart:
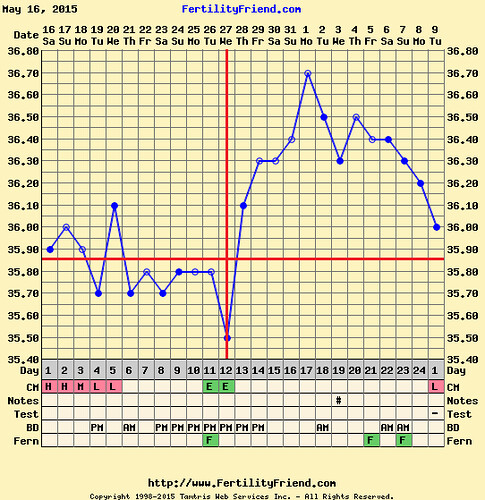
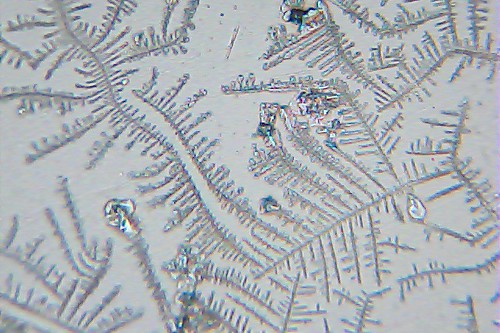
What we've learned in this cycle is that ferning during the luteal phase does not necessarily indicate pregnancy. It appears that I just had random estrogen spikes on 9 and 11 dpo. I took a pregnancy test at 13 dpo to check for any trace of hcg, even though it was already clear from my temps that af would arrive at any moment. My menses started later that day. Also this cycle I had very few symptoms. This is probably due to the lower temperatures / progesterone levels compared to previous cycles. My analysis? Probably both estrogen and progesterone levels should be elevated in order to indicate successful implantation.
This cycle lasted only 24 days, which is shorter than my usual 26 day cycle length. Maybe the egg was not viable. We don't really know though.
TTC cycle #6 for us. We're trying the fern test again together with bbt charting. Here are the saliva samples, followed by the bbt chart.
cd 1:
cd 2:
cd 3:
cd 4:
cd 5:
cd 6:
cd 7:
cd 8:
cd 9:
cd 10:
cd 11: Full ferning - indicates O in the next day or 2..
4x power:
cd 12 (O-day (confirmed by temps)):
cd 13 (1 dpo):
4x power:
cd 14 (2 dpo):
cd 15 (3 dpo):
cd 16 (4 dpo):
4x power:
cd 17 (5 dpo):
4x power:
cd 18 (6 dpo):
cd 19 (7 dpo):
4x power:
cd 20 (8 dpo):
4x power:
cd 21 (9 dpo): Full ferns! (random estrogen spike?)
4x power:
cd 22 (10 dpo):
cd 23 (11 dpo): Very full ferns! (random estrogen spike this far past O-day seems odd...)
4x power:
cd 24 (12 dpo):
cd 25 (13 dpo) / cd 1 of next cycle: Menses start
Chart:
What we've learned in this cycle is that ferning during the luteal phase does not necessarily indicate pregnancy. It appears that I just had random estrogen spikes on 9 and 11 dpo. I took a pregnancy test at 13 dpo to check for any trace of hcg, even though it was already clear from my temps that af would arrive at any moment. My menses started later that day. Also this cycle I had very few symptoms. This is probably due to the lower temperatures / progesterone levels compared to previous cycles. My analysis? Probably both estrogen and progesterone levels should be elevated in order to indicate successful implantation.
This cycle lasted only 24 days, which is shorter than my usual 26 day cycle length. Maybe the egg was not viable. We don't really know though.
Subscribe to:
Posts (Atom)